PowerPoint Report Generation with Shiny
Richard Hill and Andy Merlino
2019/07/29

In this post we generate a PowerPoint report from a Shiny app. This is Part 2 from the 3-post series about generating reports with Shiny. Part 1 covered Excel Report Generation with Shiny. See part 1 for a quick intro and description of the Shiny app that can generate Excel, PowerPoint, and PDF reports.
PowerPoint Report
These are the slides from the PowerPoint report in our Shiny app:
Click here to download the PowerPoint file from GitHub.
Creating a Basic PowerPoint with R
We use the officer R package to create the PowerPoint. officer connects R to Microsoft Word and PowerPoint (similar to how openxlsx connects R to Excel). We use the flextable package to format our PowerPoint tables.
To begin creating the PowerPoint, we assign a blank PowerPoint to the ppt_report variable:
library(officer)

ppt_report <- read_pptx()
We can now create a PowerPoint file from our ppt_report object by using the generic print() function and setting target = "<you file name>" as below:
print(ppt_report, target = "my_ppt_file.pptx")
# run `?print.rpptx` for more info on the above function
The PowerPoint we created above is completely empty, so it’s not terribly interesting. Let’s add a basic title page:
library(dplyr)

ppt_report <- ppt_report %>%
  add_slide(
    layout = "Title Slide",
    master = "Office Theme"
  ) %>%
  ph_with_text(
    type = "ctrTitle",
    str = c(
      "Example Client Name",
      "Workers' Compensation Claims Report"
    )
  )

print(ppt_report, target = "my_ppt_file.pptx")
The new version of our PowerPoint now has a title page.
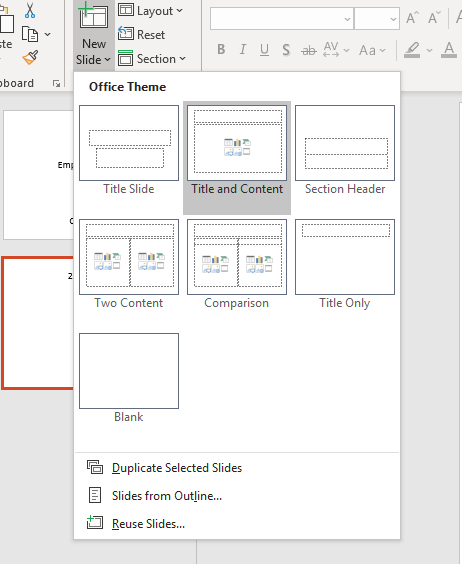
You can specify the slide theme with the master argument to add_slide() (“Office Theme” in our above example). All the layouts available with PowerPoint can be set with the layout argument. e.g. you can make slides with all the following layouts:
Using Flextables
officer can add tables, but it does not have many table formatting options. For more customized tables we use the flextable package.
Check out the code here to see the full formatting of the PowerPoint in our Shiny app.
Demo App
Below is a complete but very simple Shiny app that can generate a PowerPoint report. Simply run the following directly in your R console to run the app yourself!
library(shiny)
library(officer)
library(flextable)
library(dplyr)
my_table <- data.frame(
Name = letters[1:4],
Age = seq(20, 26, 2),
Occupation = LETTERS[15:18],
Income = c(50000, 20000, 30000, 45000)
)
ui <- fluidRow(
column(
width = 12,
align = "center",
tableOutput("data"),
br(),
downloadButton("download_powerpoint", "Download Data to PowerPoint")
)
)
server <- function(input, output) {
output$data <- renderTable({
my_table
})
output$download_powerpoint <- downloadHandler(
filename = function() {
"employee_data.pptx"
},
content = function(file) {
flextable_prep <- flextable(my_table) %>%
colformat_num(col_keys = c("Age", "Income"), digits = 0) %>%
width(width = 1.25) %>%
height_all(height = 0.35) %>%
theme_zebra() %>%
align(align = "center", part = "all")
example_pp <- read_pptx() %>%
add_slide(layout = "Title Slide", master = "Office Theme") %>%
ph_with_text(
type = "ctrTitle",
str = "Employee Data"
) %>%
ph_with(
location = ph_location_type(type = "subTitle"),
value = "Company 2019 Report"
) %>%
add_slide(layout = "Title and Content", master = "Office Theme") %>%
ph_with_text(
type = "title",
str = "2019 Data"
) %>%
ph_with_flextable_at(
value = flextable_prep,
left = 2.5,
top = 2
)
print(example_pp, target = file)
}
)
}
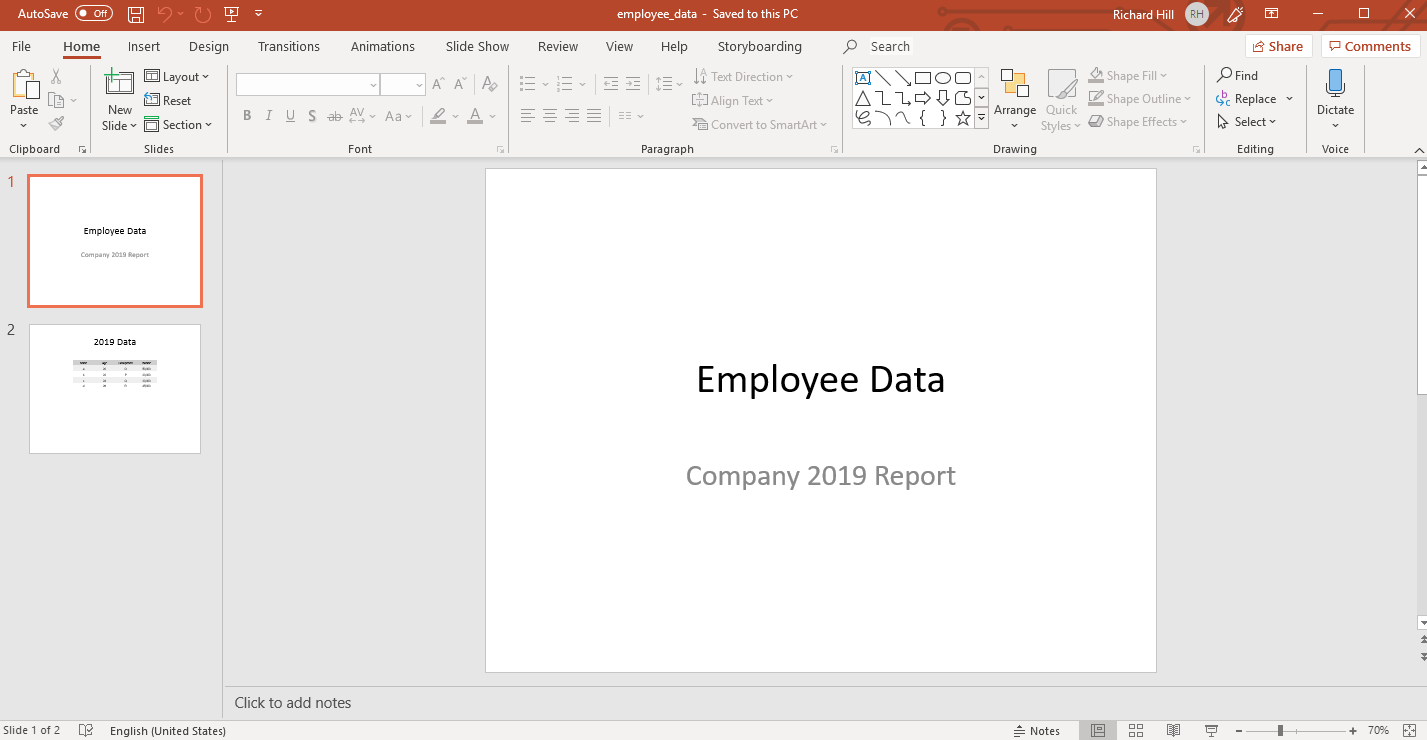
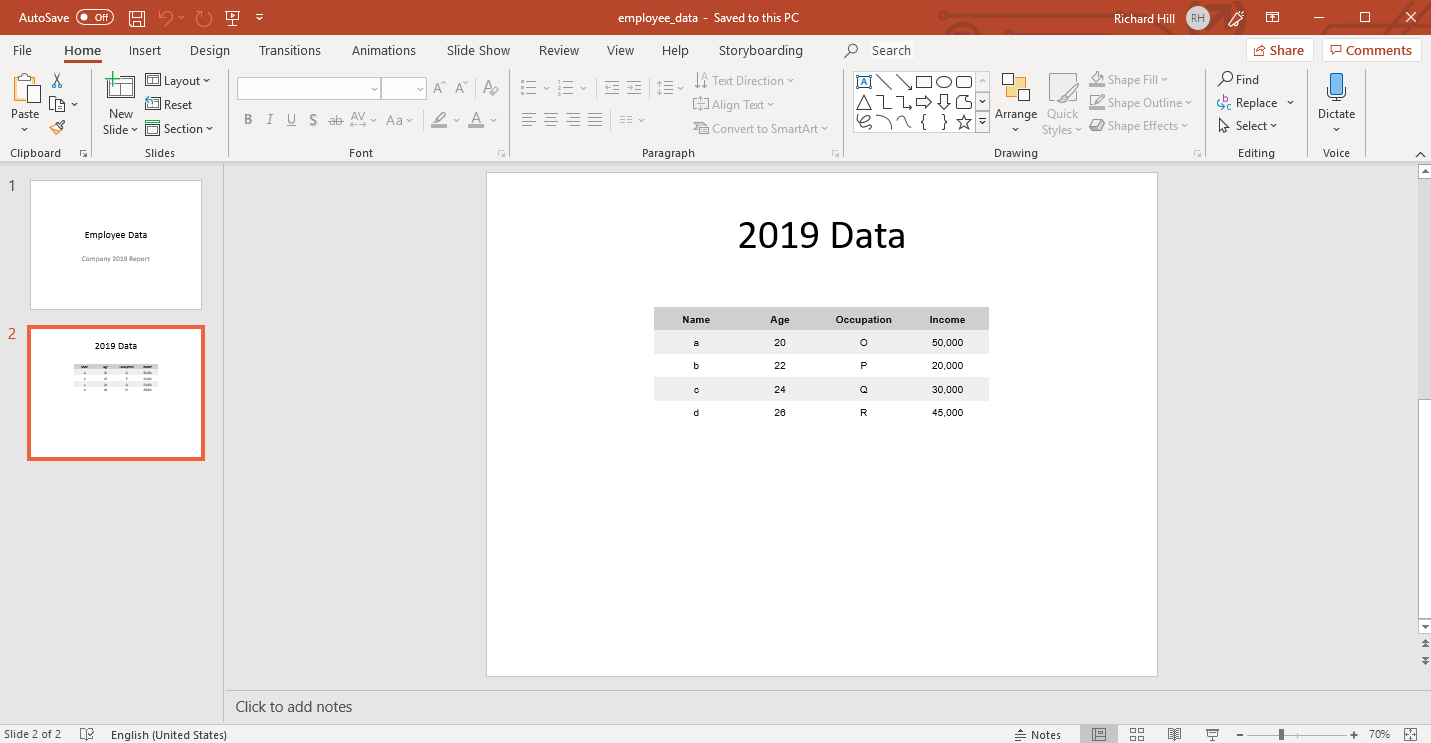
shinyApp(ui, server)Which will download this basic PowerPoint:
comments powered by Disqus